Profiling the Naive Redis Clone
In the last post we ran a benchmark on our naive Redis clone. It performed already impressively. To improve its performance, the first step is to understand where the time goes in the program.

Flight Recording
The first thing I did was to run the built-in Java Flight recorder on the program. The flight recorder is a lightweight profiler built into Java. It is designed for profiling in production.
I started the flight recorder right away by using this command line. Without any extra arguments, using the defaults:
java -XX:StartFlightRecording=filename=trace.jfr,dumponexit=true,disk=true \
-jar redis-experiment.jar
Then I ran the benchmark again. This time for 60 seconds, to have a bit longer run time of the profiling data.
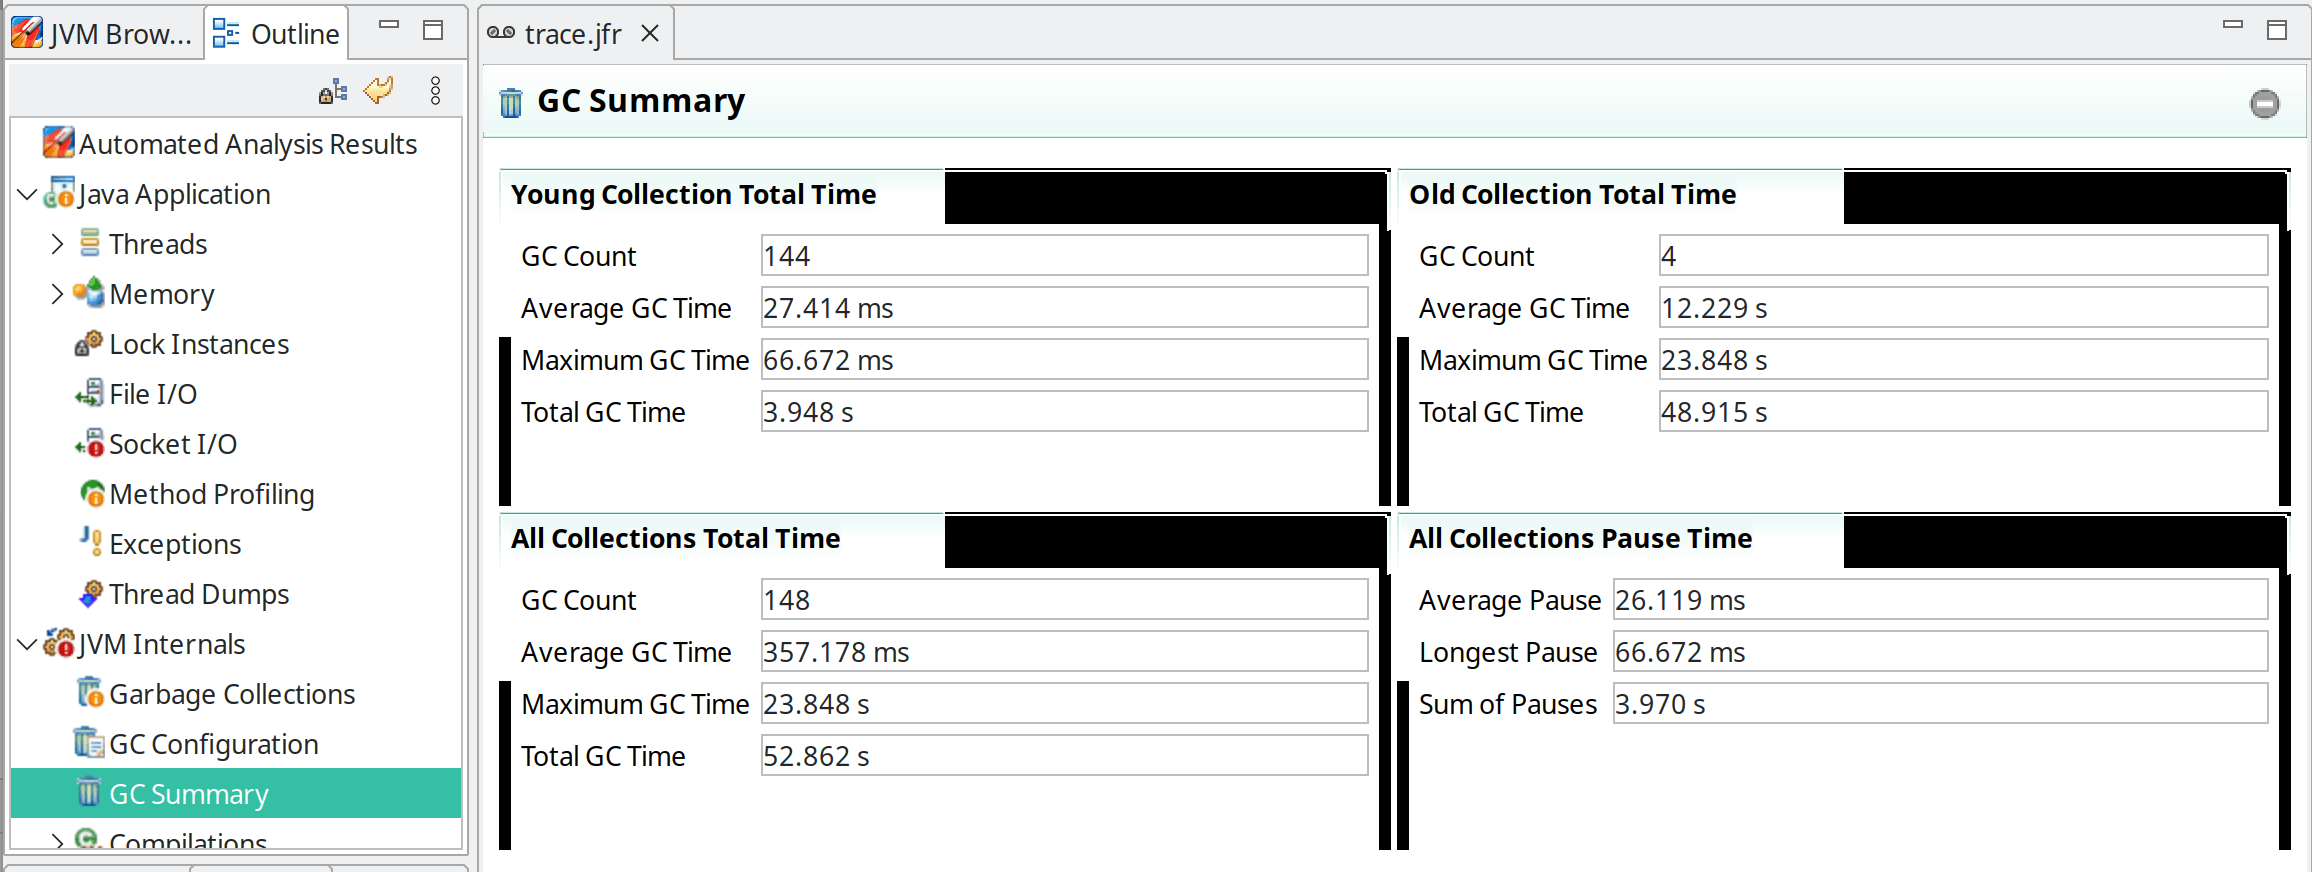
I then look at the results with the JDK Mission Control tool. The recording contains a wide range of diagnostics data from the runtime, like GC logs, CPU and memory usage, class loading, exceptions, threads, etc. I am giving here some data collected:
The GC doesn’t have a crazy high max pause time with 66 milliseconds. However, it is working hard, as indicated by the 52 seconds it ran, during the 60 seconds of benchmarking.
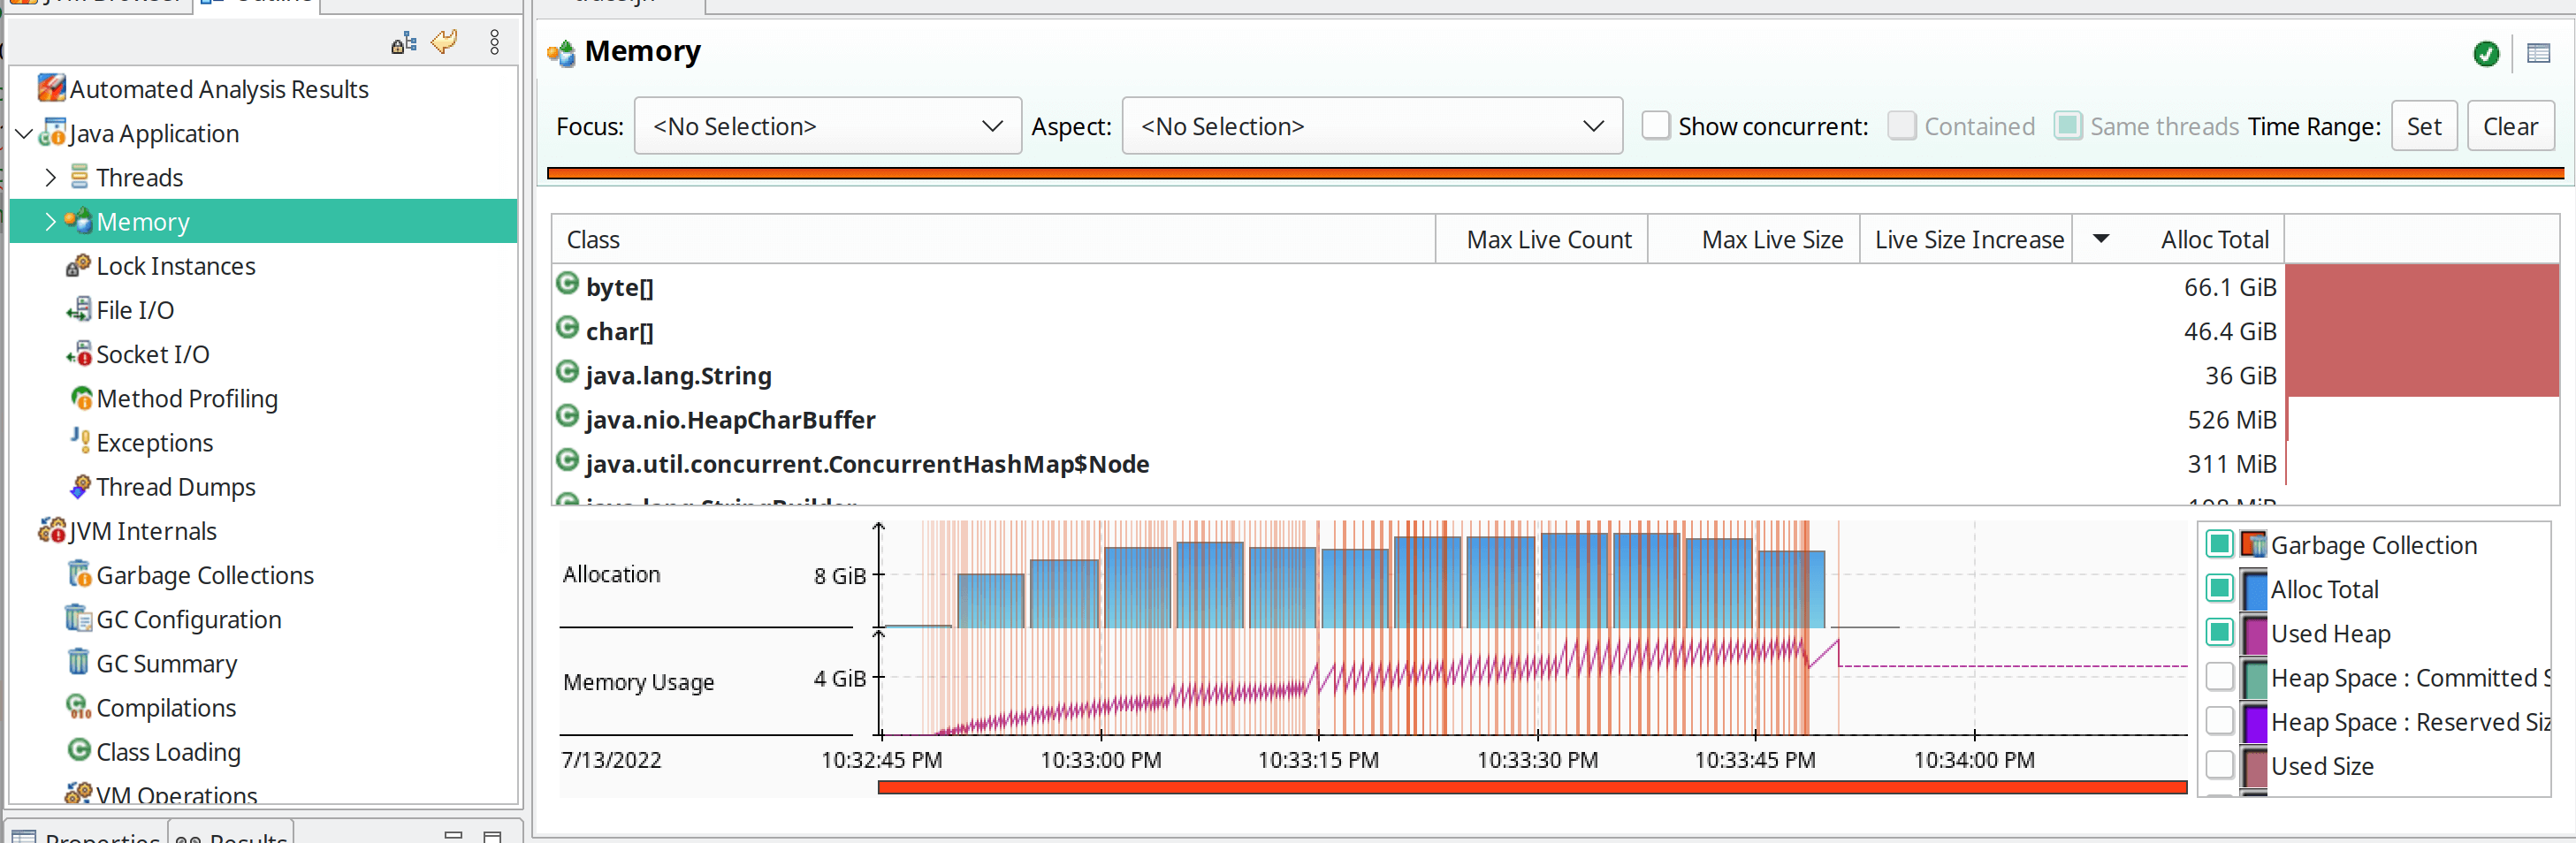
When the GC is working so hard, what are we then allocating? As you can see, a lot of bytes, chars, and Strings. About 146GByte of it, within the 60 seconds benchmark run.
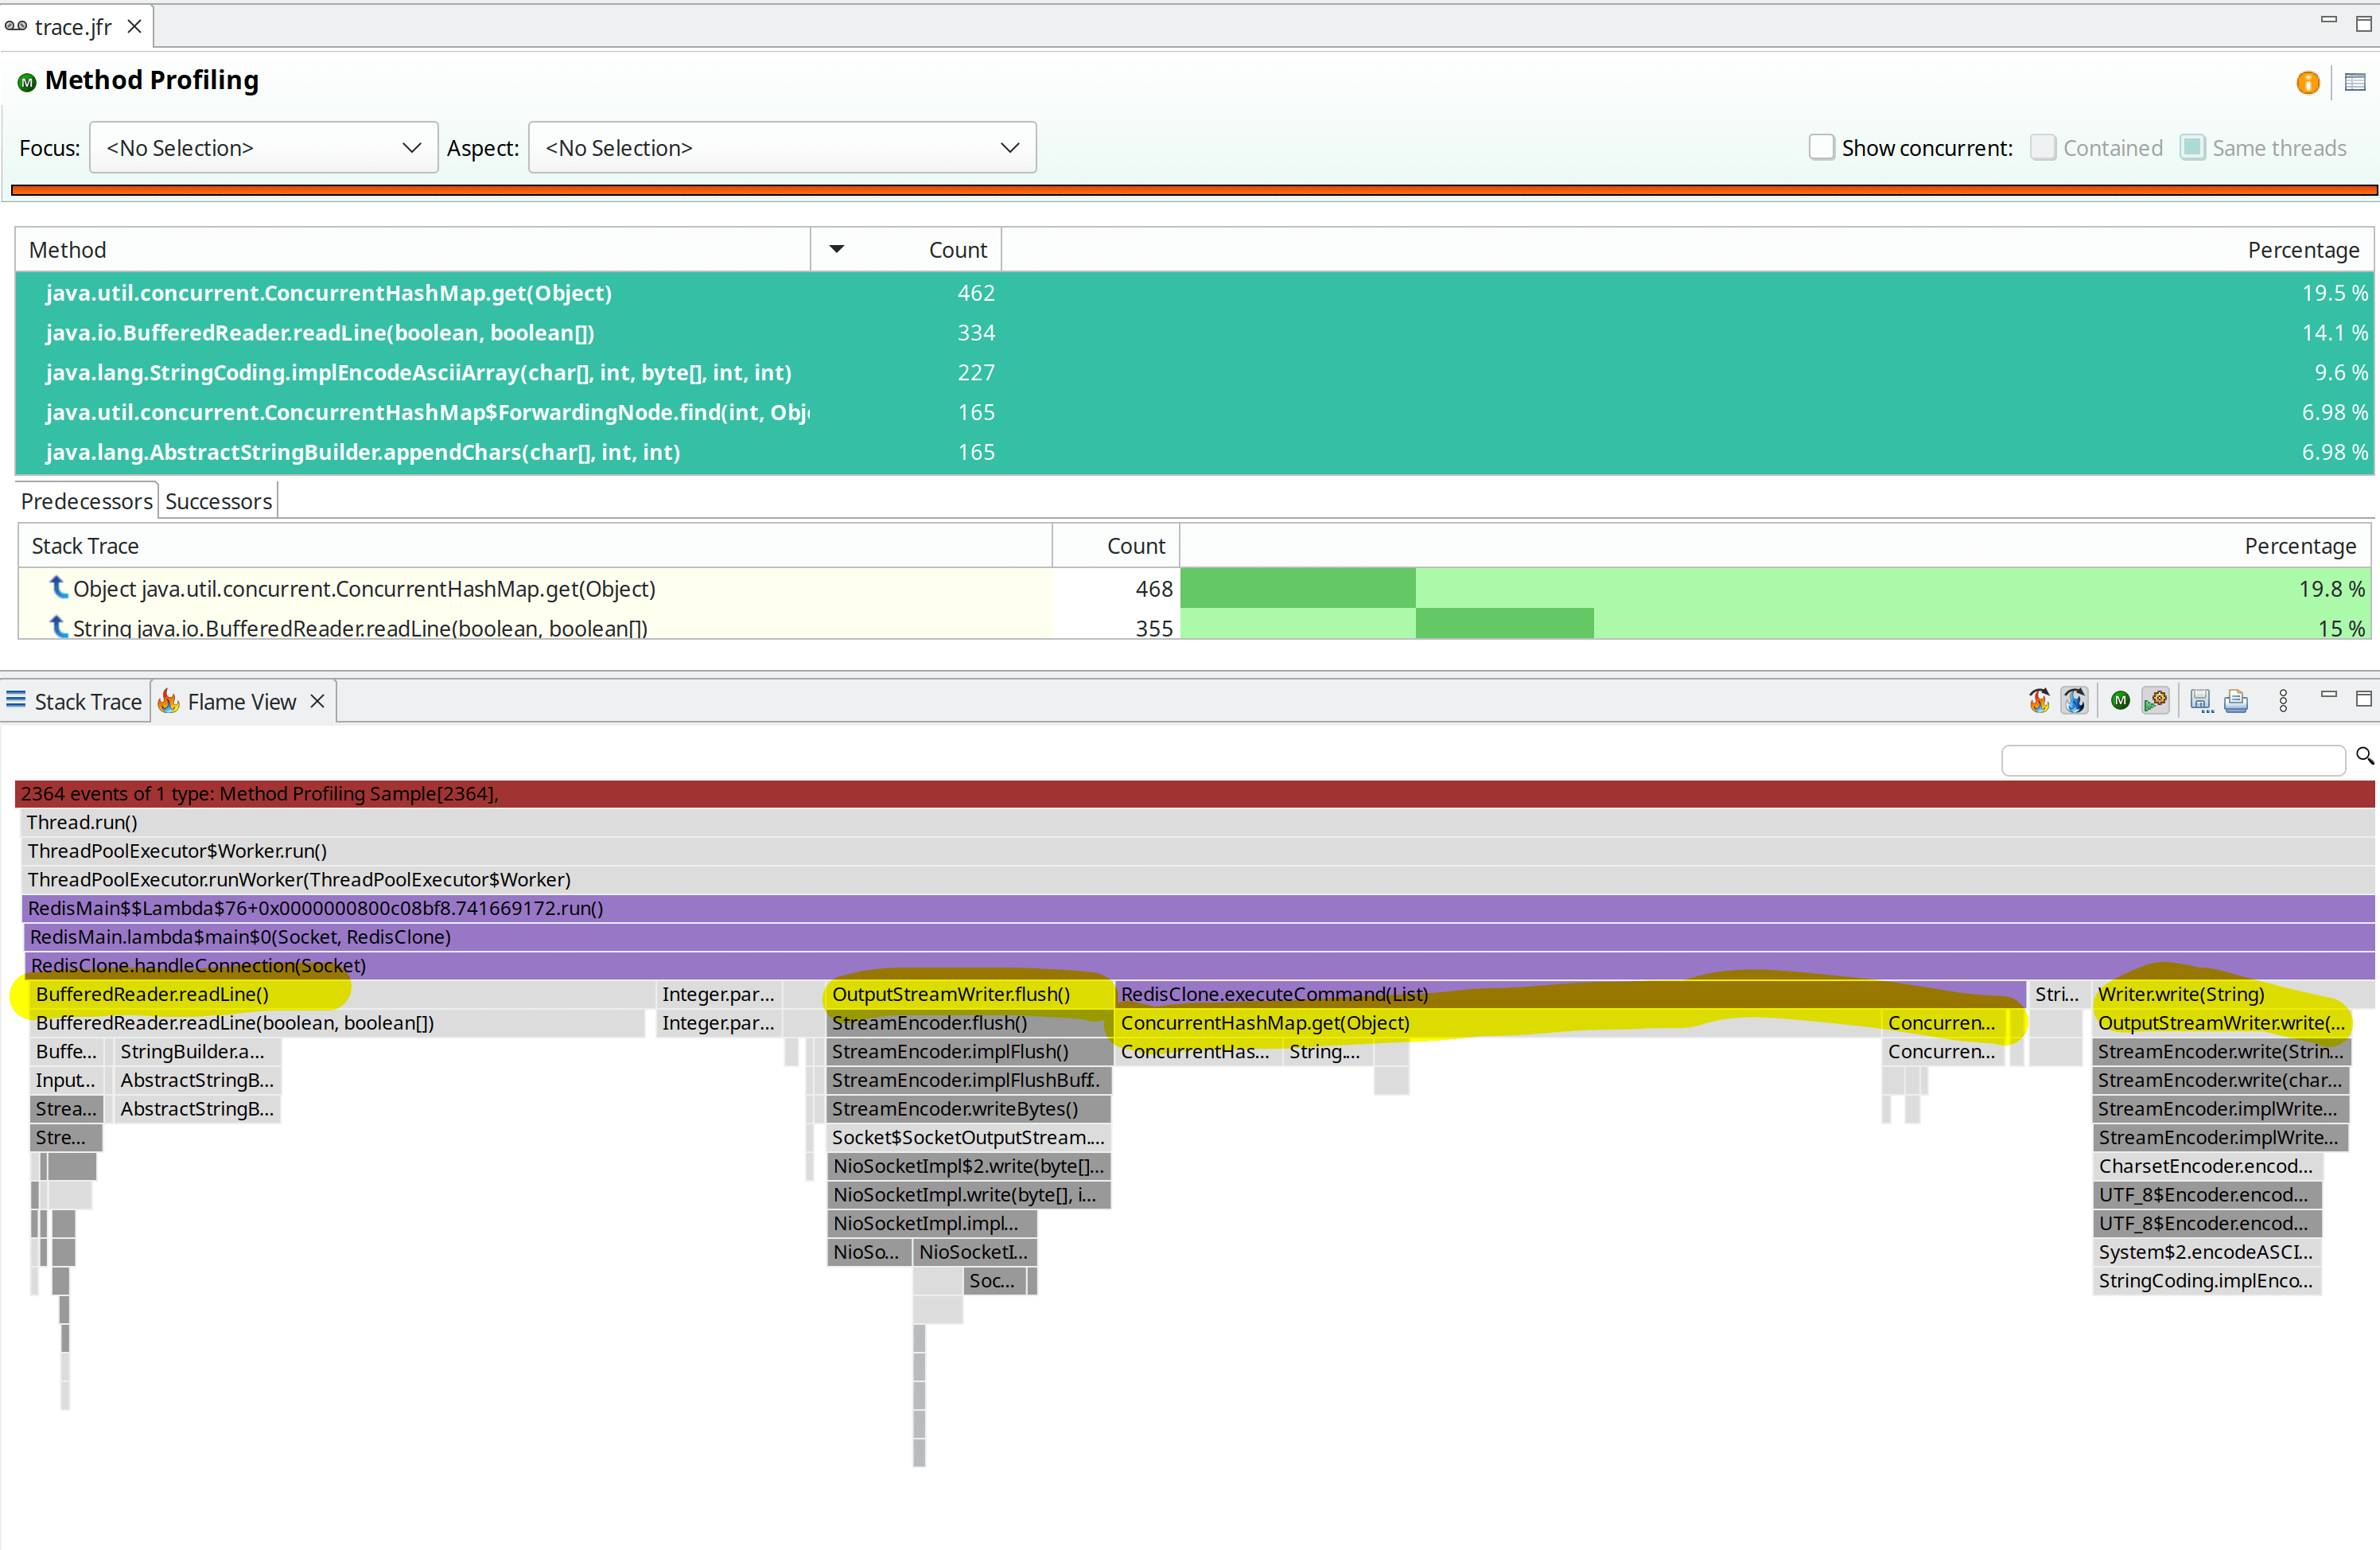
I also took a short look at the method sampler. The Flight Recorder Method sampler by default isn’t super precise, but a great sanity check. It is useful in real-world apps in production, to check that no unexpected code path dominates. In our small app, we see code we roughly expect. Reading lines, getting stuff, and writing back:
Async Profiler
The flight recorder is great to have an overall overview. However, for actual profiling I’m using the async-profiler
Again, I start the profiler with the application. I’ll do both, a wall clock profile and CPU profile. Additionally, I cranked up the sampling rate to 1ms for this example.
# The CPU profile
java -agentpath:$PWD//async-profiler-2.8.1-linux-arm64/build/libasyncProfiler.so=start,event=cpu,file=profile-cpu.html,interval=1000000 \
-jar redis-experiment.jar
# The Wall clock profile
java -agentpath:$PWD//async-profiler-2.8.1-linux-arm64/build/libasyncProfiler.so=start,event=wall,file=profile-wall.html,interval=1000000 \
-jar redis-experiment.jar
# Wall clock profile, per thread
java -agentpath:$PWD//async-profiler-2.8.1-linux-arm64/build/libasyncProfiler.so=start,event=wall,threads,file=profile-wall-thread.html,interval=1000000 \
-jar redis-experiment.jar
When taking a look at the wall clock time, it is dominated by the line read. This is of course not the actual reading, but waiting for a command from the client. Then next item dominating the wall clock is the flush:
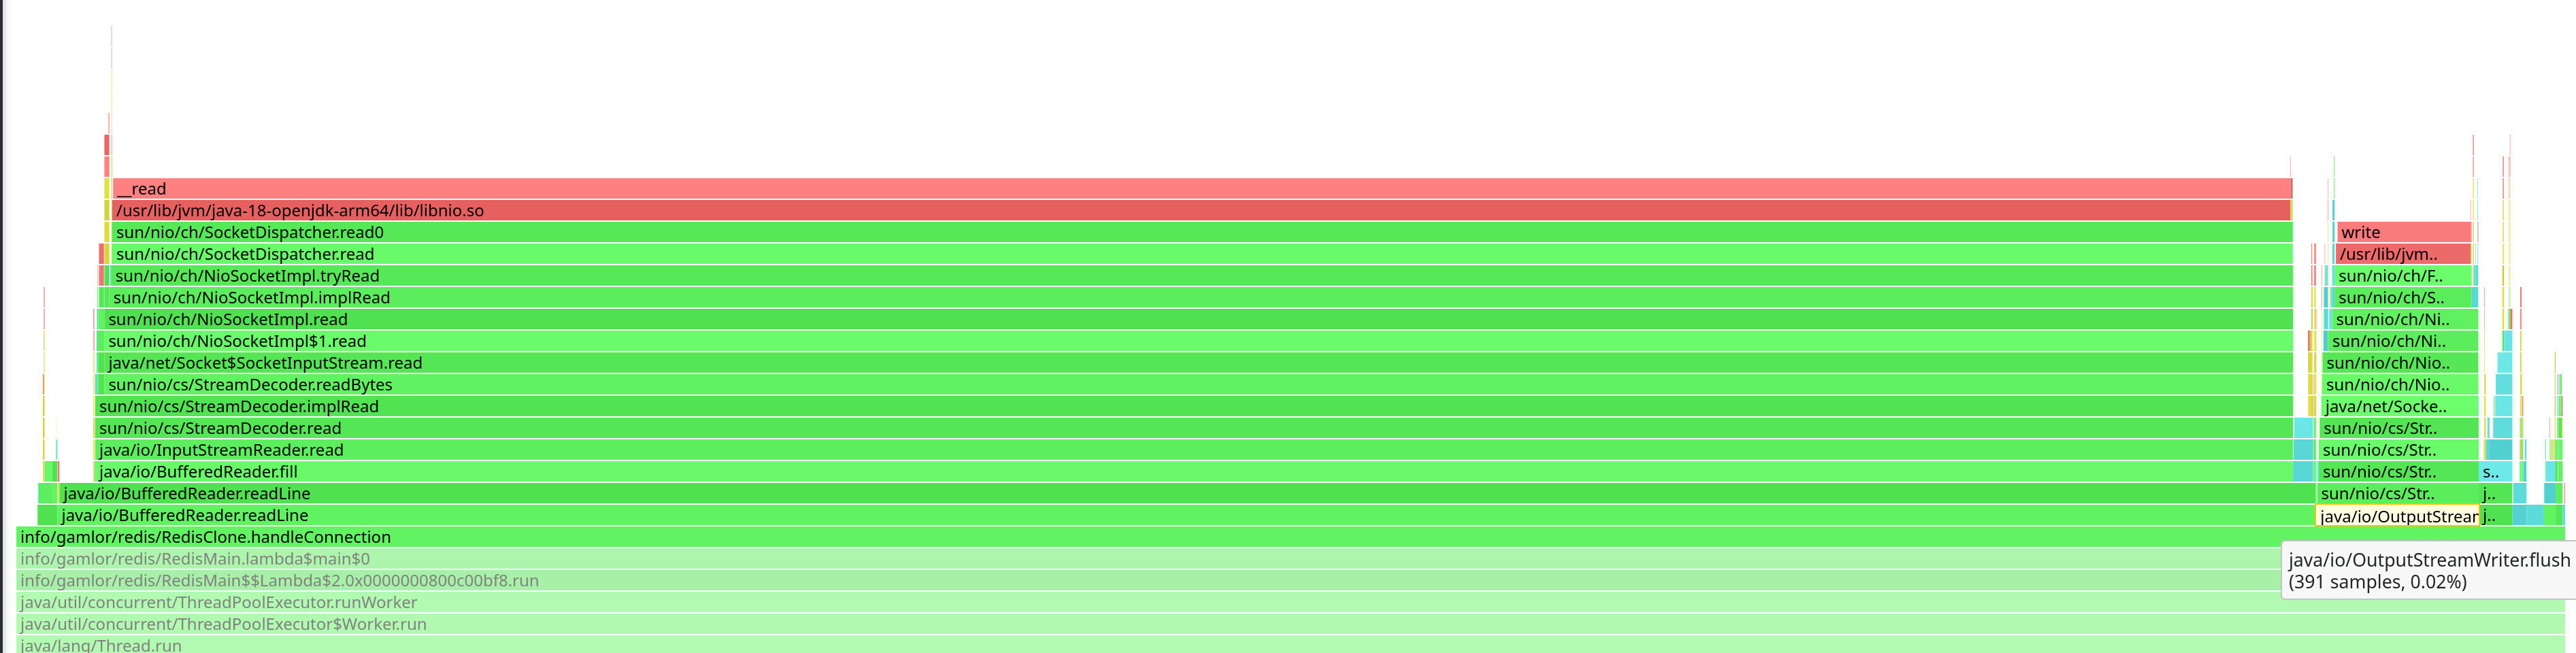
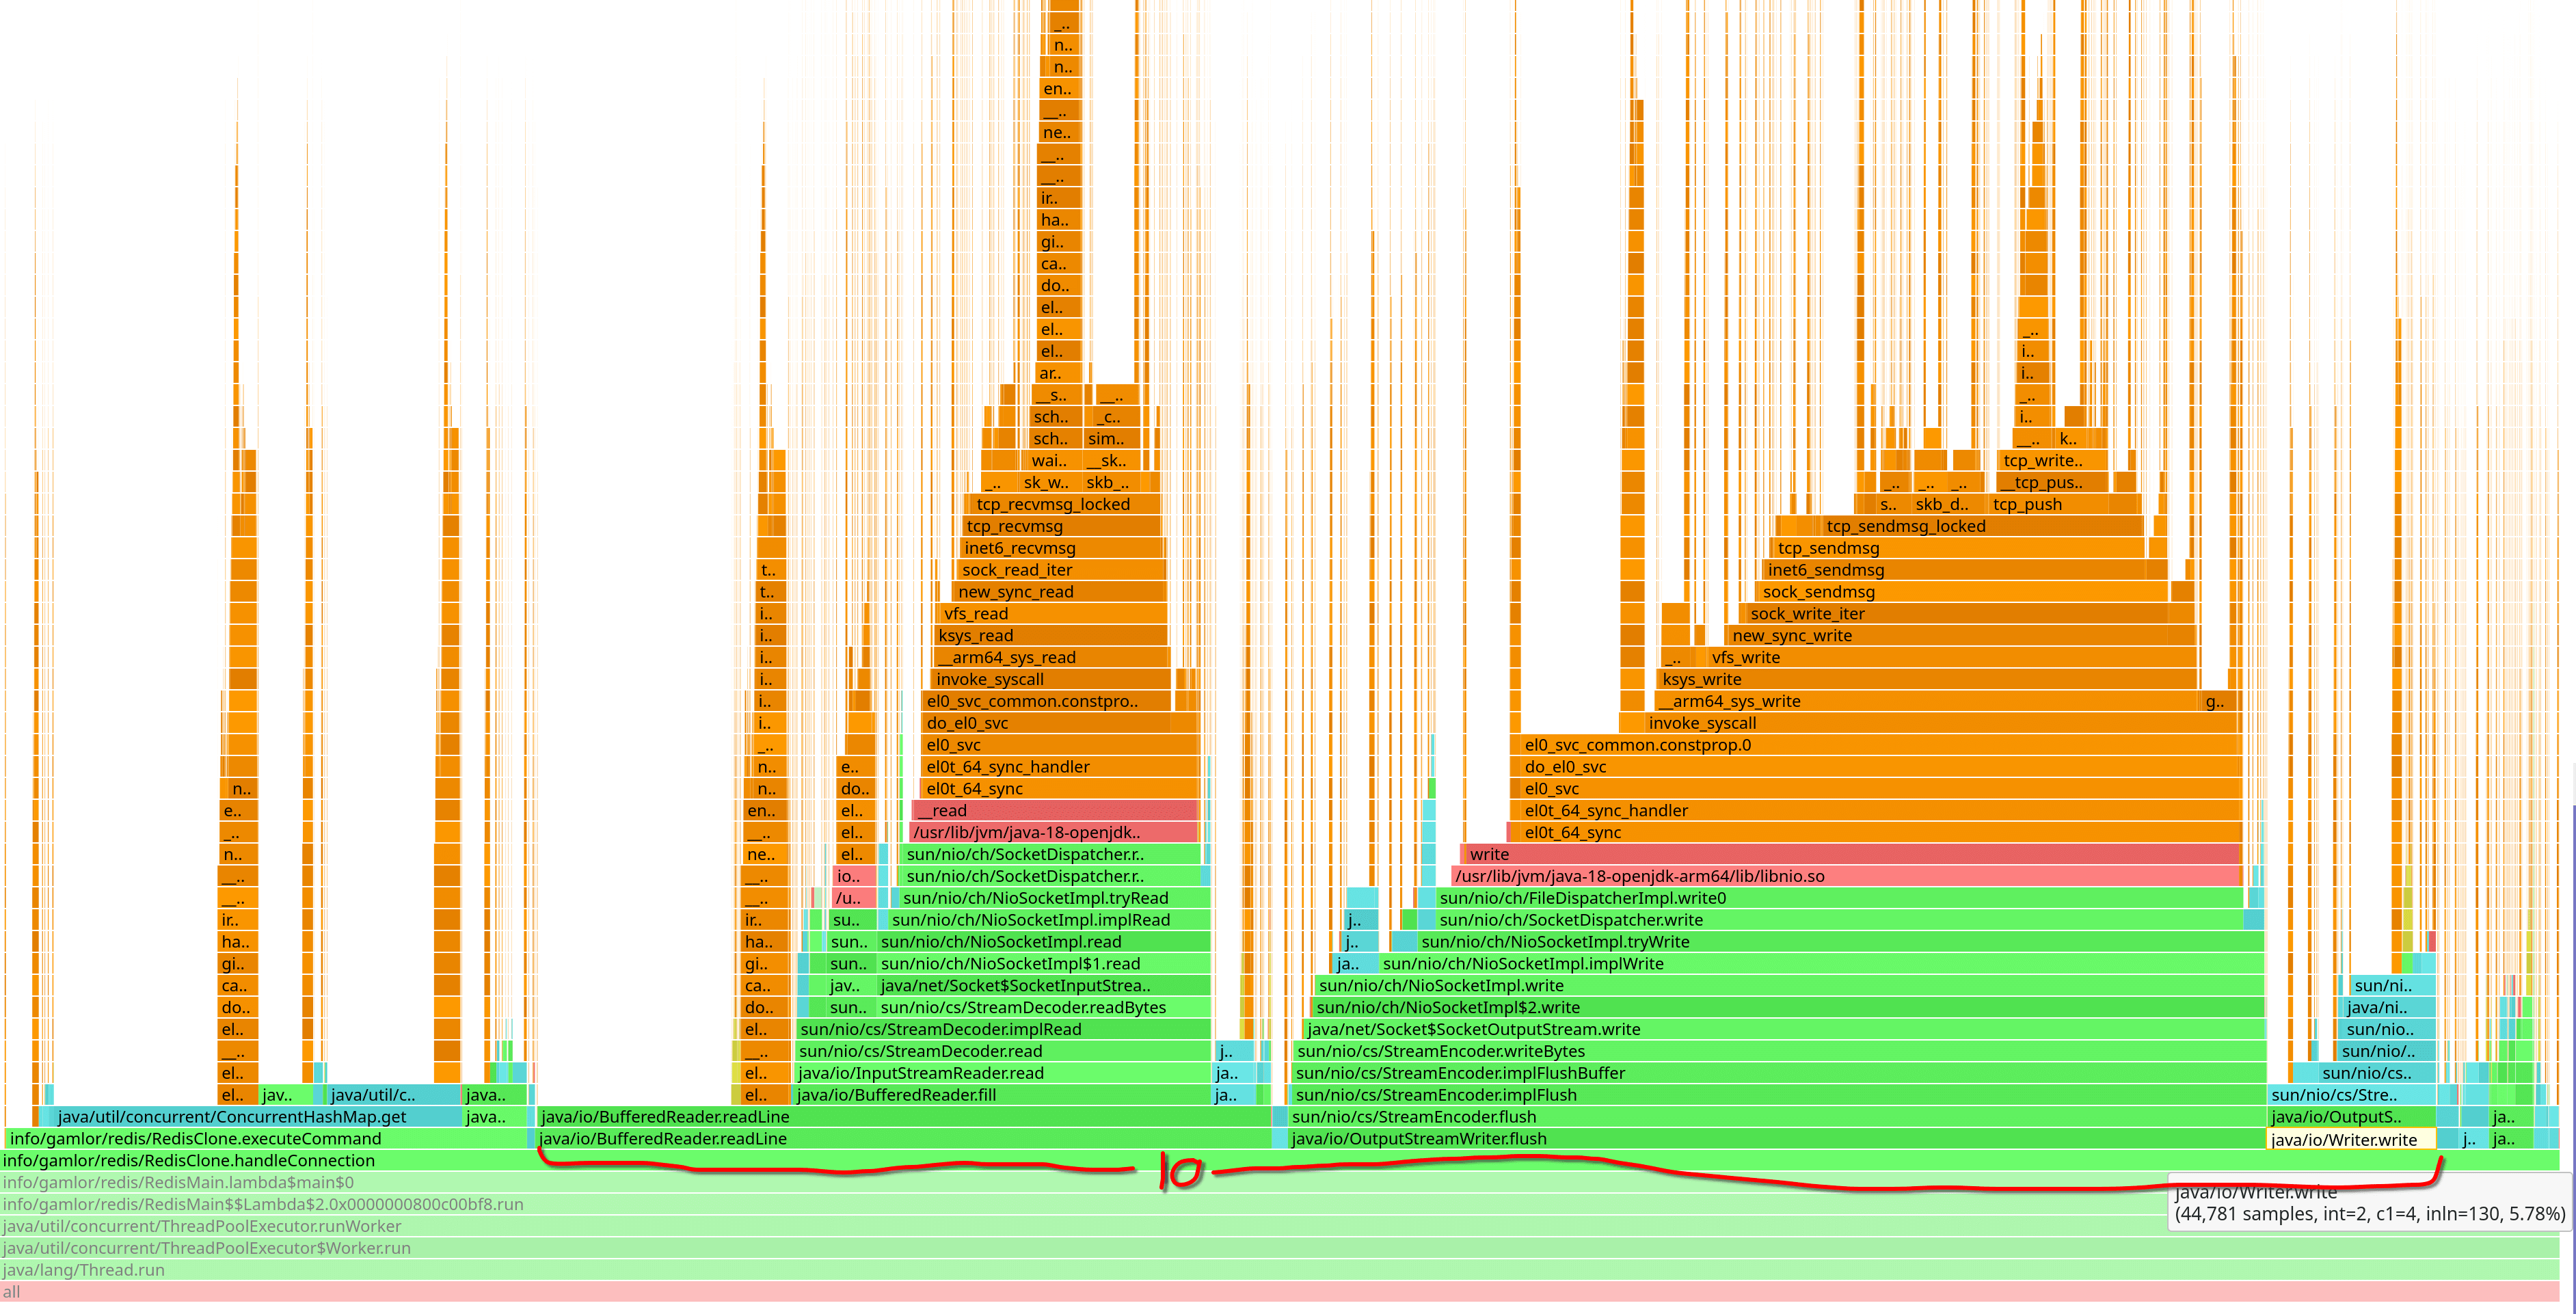
In the CPU profiling we see that spend a lot of time in IO overall:
Some Conclusions
I take away some initial conclusions:
We wait a long time from commands arrive.
We spend a lot of time in IO. Especially we wait on the flush. And during the flush, we can’t process new commands.
We are quite memory intense, giving a lot of work to the GC. Plus all these allocations and garbage collecting puts pressure on the memory subsystem of your system.
Plans for Improvements
So, I plan to address the IO time first. For example, it would be better if we only flush the buffers to the client if there is nothing else coming right after. If there are more commands being processed anyway, we could avoid the flushing, making the IO more pipelined. Or at least start reading the next command while the flushing is going on.
Traditionally we would need to switch to async IO to do this. However, I might try a 'synchronous' version first, with the upcoming Structured Concurrency (JEP 428)
Stay tuned ;)