Debug Hanging Programs with Thread- and Heap-Dumps
I used this technique a surprising amount of times to find out an issue. It all starts with a hanging Java program: a build tool, some Java based server, etc.
The first thing I do in this case is to take a stack trace. For example with jstack
jstack $PID
"Reference Handler" #9 [1050125] daemon prio=10 os_prio=0 cpu=0.22ms elapsed=7.77s tid=0x00007b23222b5c20 nid=1050125 waiting on condition  [0x00007b22fdeb4000]
   java.lang.Thread.State: RUNNABLE
        at java.lang.ref.Reference.waitForReferencePendingList(java.base@21.0.4/Native Method)
        at java.lang.ref.Reference.processPendingReferences(java.base@21.0.4/Reference.java:246)
        at java.lang.ref.Reference$ReferenceHandler.run(java.base@21.0.4/Reference.java:208)

"Finalizer" #10 [1050126] daemon prio=8 os_prio=0 cpu=0.20ms elapsed=7.77s tid=0x00007b23222b7280 nid=1050126 in Object.wait()  [0x00007b22fddb3000]
   java.lang.Thread.State: WAITING (on object monitor)
        at java.lang.Object.wait0(java.base@21.0.4/Native Method)
        - waiting on <0x000000063d001730> (a java.lang.ref.NativeReferenceQueue$Lock)

# Snip, more JDK threads

"pool-1-thread-2" #32 [1051001] prio=5 os_prio=0 cpu=1.41ms elapsed=9.44s tid=0x00007434523e7120 nid=1051001 waiting on condition  [0x000074342c1d4000]
   java.lang.Thread.State: TIMED_WAITING (sleeping)
        at java.lang.Thread.sleep0(java.base@21.0.4/Native Method)
        at java.lang.Thread.sleep(java.base@21.0.4/Thread.java:509)
        at info.gamlor.FileLockMechanism.retryLock(FileLockMechanism.java:25)
        at info.gamlor.FileLockMechanism.waitForLock(FileLockMechanism.java:20)
        at info.gamlor.FileLockMechanism.aquireWriteLock(FileLockMechanism.java:16)
        at info.gamlor.YadaEngine.listWorkBasedOnFile(YadaEngine.java:14)
        at info.gamlor.YadaEngine.listWork(YadaEngine.java:9)
        at info.gamlor.YadaEngine.findWork(YadaEngine.java:5)
        at info.gamlor.DemoApp$2.run(DemoApp.java:36)
        at java.util.concurrent.ThreadPoolExecutor.runWorker(java.base@21.0.4/ThreadPoolExecutor.java:1144)
        at java.util.concurrent.ThreadPoolExecutor$Worker.run(java.base@21.0.4/ThreadPoolExecutor.java:642)
        at java.lang.Thread.runWith(java.base@21.0.4/Thread.java:1596)
        at java.lang.Thread.run(java.base@21.0.4/Thread.java:1583)


# Snip, more thread pool threads waiting for work.

"pool-1-thread-2" #32 [1051001] prio=5 os_prio=0 cpu=1.41ms elapsed=9.44s tid=0x00007434523e7120 nid=1051001 waiting on condition  [0x000074342c1d4000]
   java.lang.Thread.State: TIMED_WAITING (sleeping)
        at java.lang.Thread.sleep0(java.base@21.0.4/Native Method)
        at java.lang.Thread.sleep(java.base@21.0.4/Thread.java:509)
        at info.gamlor.FileLockMechanism.retryLock(FileLockMechanism.java:25)
        at info.gamlor.FileLockMechanism.waitForLock(FileLockMechanism.java:20)
        at info.gamlor.FileLockMechanism.aquireWriteLock(FileLockMechanism.java:16)
        at info.gamlor.YadaEngine.listWorkBasedOnFile(YadaEngine.java:14)
        at info.gamlor.YadaEngine.listWork(YadaEngine.java:9)
        at info.gamlor.YadaEngine.findWork(YadaEngine.java:5)
        at info.gamlor.DemoApp$2.run(DemoApp.java:36)
        at java.util.concurrent.ThreadPoolExecutor.runWorker(java.base@21.0.4/ThreadPoolExecutor.java:1144)
        at java.util.concurrent.ThreadPoolExecutor$Worker.run(java.base@21.0.4/ThreadPoolExecutor.java:642)
        at java.lang.Thread.runWith(java.base@21.0.4/Thread.java:1596)
        at java.lang.Thread.run(java.base@21.0.4/Thread.java:1583)

"http-handler-1" #41 [1050155] prio=5 os_prio=0 cpu=0.40ms elapsed=7.69s tid=0x00007b232241f240 nid=1050155 waiting on condition  [0x00007b22fc5cc000]
   java.lang.Thread.State: WAITING (parking)
        at jdk.internal.misc.Unsafe.park(java.base@21.0.4/Native Method)
        - parking to wait for  <0x000000063d3c0e88> (a java.util.concurrent.locks.AbstractQueuedSynchronizer$ConditionObject)
        at java.util.concurrent.locks.LockSupport.park(java.base@21.0.4/LockSupport.java:371)
        at java.util.concurrent.locks.AbstractQueuedSynchronizer$ConditionNode.block(java.base@21.0.4/AbstractQueuedSynchronizer.java:519)
        at java.util.concurrent.ForkJoinPool.unmanagedBlock(java.base@21.0.4/ForkJoinPool.java:3780)
        at java.util.concurrent.ForkJoinPool.managedBlock(java.base@21.0.4/ForkJoinPool.java:3725)
        at java.util.concurrent.locks.AbstractQueuedSynchronizer$ConditionObject.await(java.base@21.0.4/AbstractQueuedSynchronizer.java:1707)
        at java.util.concurrent.LinkedBlockingQueue.take(java.base@21.0.4/LinkedBlockingQueue.java:435)
        at java.util.concurrent.ThreadPoolExecutor.getTask(java.base@21.0.4/ThreadPoolExecutor.java:1070)
        at java.util.concurrent.ThreadPoolExecutor.runWorker(java.base@21.0.4/ThreadPoolExecutor.java:1130)
        at java.util.concurrent.ThreadPoolExecutor$Worker.run(java.base@21.0.4/ThreadPoolExecutor.java:642)
        at java.lang.Thread.runWith(java.base@21.0.4/Thread.java:1596)
        at java.lang.Thread.run(java.base@21.0.4/Thread.java:1583)

# Snip, More http handlers

# Snip, More JDK threads
I then roughly scan the thread dump for threads that are candidates for hanging:
Threads talking to the Internet, Database etc
Threads talking to the file system, etc
Threads that seem to wait on some condition
In this example we see a thread doing some background work and one waiting for a file lock. That looks like a prime candidate!
But how do we find out on what file waits on?
For that I take a head dump jmap -dump:format=b,file=$PWD/dump.hprof $PID.
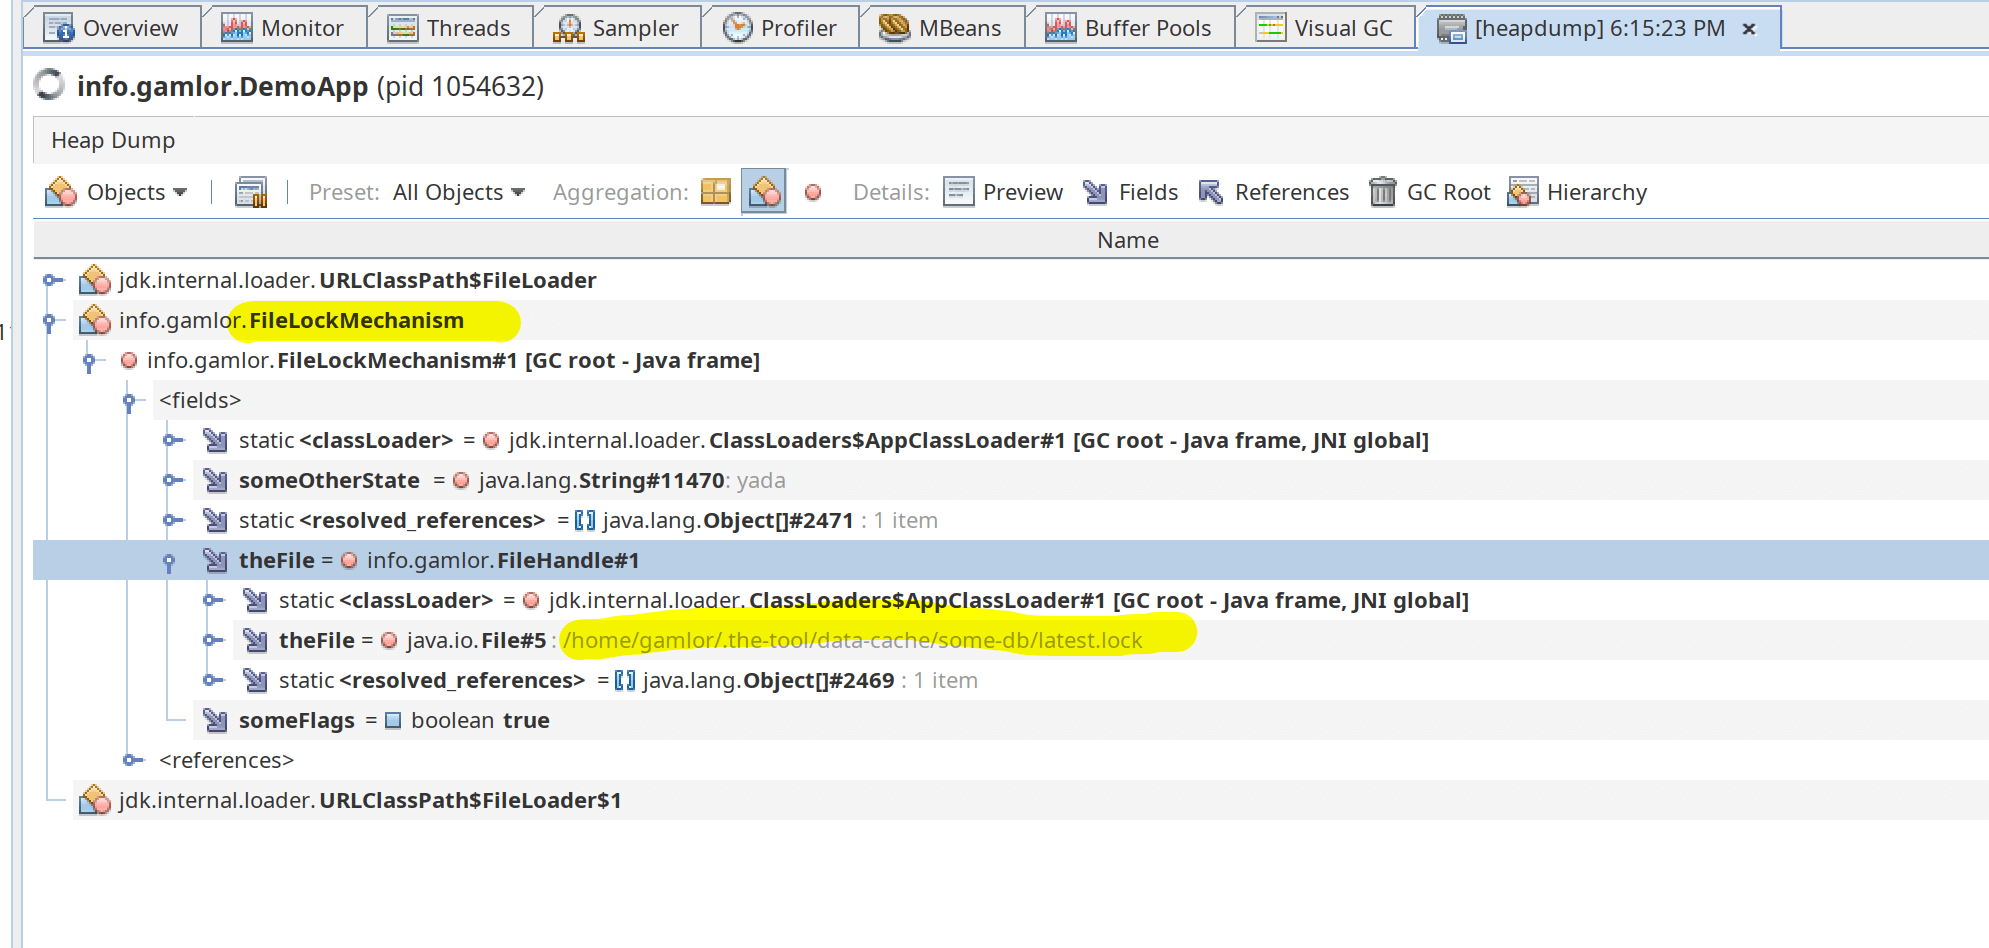
Then I analyse it, for example with VisualVM
I search for classes involved in the hanging thread and inspect their fields.
In this example it is the YadaEngine and FileLockMechanism.
Quite often this reveals on what the app is hanging:
On what network connection, web-service, file etc.
In this example, it is a lock file the app waits on.
That hint then helps me find / resolving the issue. Like the network miss configuration, the left-over lock file, etc.
That’s it: It is simple, yet I figured out several issue this way. Thread and heap dumps helping me help in hand =)