VisualVM
VisualVM is an awesome tool! It is one of the best tools shipped with the JDK. I’m always astonished when people do know nothing about it. Here’s a short tour through VisualVM.
Where is it?
VisualVM is in the bin directory of your JDK installation. For example on my windows machine it’s here ‘C:\Program Files (x86)\Java\jdk1.7.0\bin\visualvm.exe’. If you cannot find it you can always download the newest version here: http://visualvm.java.net/
Overview
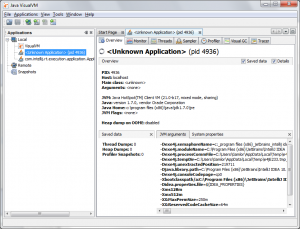
When you start up VisualVM you see all local running JVMs on the left. When you double click on one a tab opens up on the left with all kinds of details. Each tab reveals more information, like memory usage, running threads etc:
Analyzing Memory
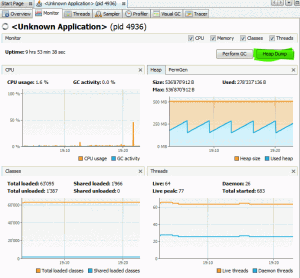
I use VisualVM most often to get a quick overview of the memory usage. I’ve found and fixed countless memory issues only with VisualVM and without any advanced profiling. In the ‘Monitor’-tab you directly can see the memory usage and the Zig-Zag line of the CG cycles:
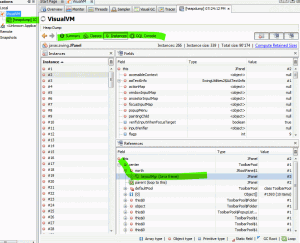
Now what I often use is the ‘Heap Dump’ button. It creates a regular heap dump. After you’ve created one you can analyze it directly in VisualVM. You see the allocated objects, how much memory they use etc. And most importantly you can right click on an object and find out via which root object an object is reachable:
When I have a suspicious memory leak I often search for instances of a classes which are most likely responsible. Then I find out via which root they are reachable and if they are supposed to be reachable. Of course you can analyze the created heap dump as with any other tool.
Visual GC Plugin
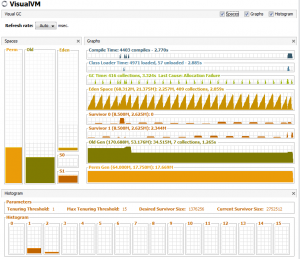
For a detailed view on garbage collector activities you can install the Visual GC Plugin. Just go to ‘Tools->Plugins’, search for ‘Visual GC’ and install it. After that you have the ‘Visual GC’ tab available. That tab shows you a detailed overview of the memory usage of each generation and the GC cycles in each generation:
Sampler / Profiling
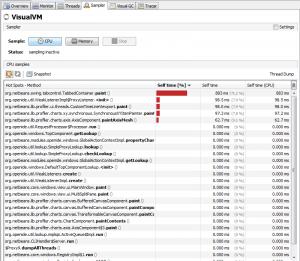
The ‘Sampler’ and ‘Profiling’ give you simple profiler capabilities. The ‘Sampler’ basically looks at the execution stack at a certain sample rate and from there infers how much time / memory is used. The ‘Profiling’ tab allows you to instrument certain code and measure more precisely how much time is used:
Tracer Plugins
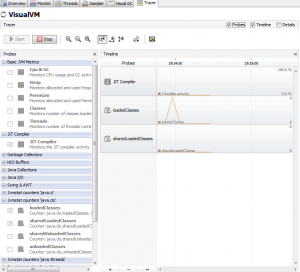
The ‘Tracer’-plugins are another cool extension to Visual VM. You can get those also via ‘Tools->Plugins’. They basically allow you monitor very specific things in the VM, like IO usage, JIT compilation etc.
Conclusion
VisualVM is a cool tool. If you don’t know it, start playing with it, you won’t regret it.


To launch Java VisualVM in Mac OS X, run “jvisualvm” from the command line.